Inside your structural break practice
Every image on this page reflects your core focus: careful AI structural break detection
on long-horizon financial time series, built for researchers who demand clarity,
traceability, and serious documentation.

Why you care about structural breaks in long-term financial data
You are not chasing hype cycles or buzzwords; you are building durable tools for people who live with long-horizon financial data and need structural break analysis they can defend in serious conversations.
You built Sundoravitel for researchers who care more about structural integrity than slogans, and
who need AI to behave like a disciplined assistant inside serious financial time series
work.
How you keep AI structural break detection accountable
You design Sundoravitel around a simple idea: if you cannot explain how an AI model flagged a structural break in a financial time series, you should not be using it in serious research.
You start by making every step visible. Data preprocessing, feature construction,
and model choices are logged in plain language, alongside configuration details.
When an AI routine suggests a structural break, you can trace it back to the exact
transformations and thresholds involved. This traceability matters when you sit
across from a risk committee, a co-author, or an internal reviewer who wants to know
precisely how you arrived at a particular breakpoint in a decades-long series.
You also design the system to sit comfortably inside existing research environments.
Outputs integrate with common statistical tools and reporting formats, so you do not
need to rebuild your workflow around a new interface. Instead, structural break
markers, confidence measures, and impact metrics slot into the analyses you already
run, adding structure rather than disruption. The AI becomes one more instrument on
your bench, not the entire workshop.
Throughout, you keep a clear boundary between analysis and action. Sundoravitel supports
understanding market dynamics and structural change; it does not tell anyone what to
buy, sell, or hold. You encourage users to combine AI-driven structural break
detection with their own Sundoravitel knowledge, risk frameworks, and professional advice.
Past performance does not guarantee future results, and any interpretation of breaks
remains the responsibility of the researcher.
About your structural break lab
You stand over decades of market data, looking for the moment the pattern quietly changed. Sundoravitel exists for that moment, building AI structural break detection that treats every long-term financial time series as a craft project, not a commodity feed.
You work with academics, institutional analysts, and quant teams who need to detect and quantify structural breaks with discipline. Every workflow is designed around clear assumptions, reproducible steps, and documentation that can stand in front of a review committee.
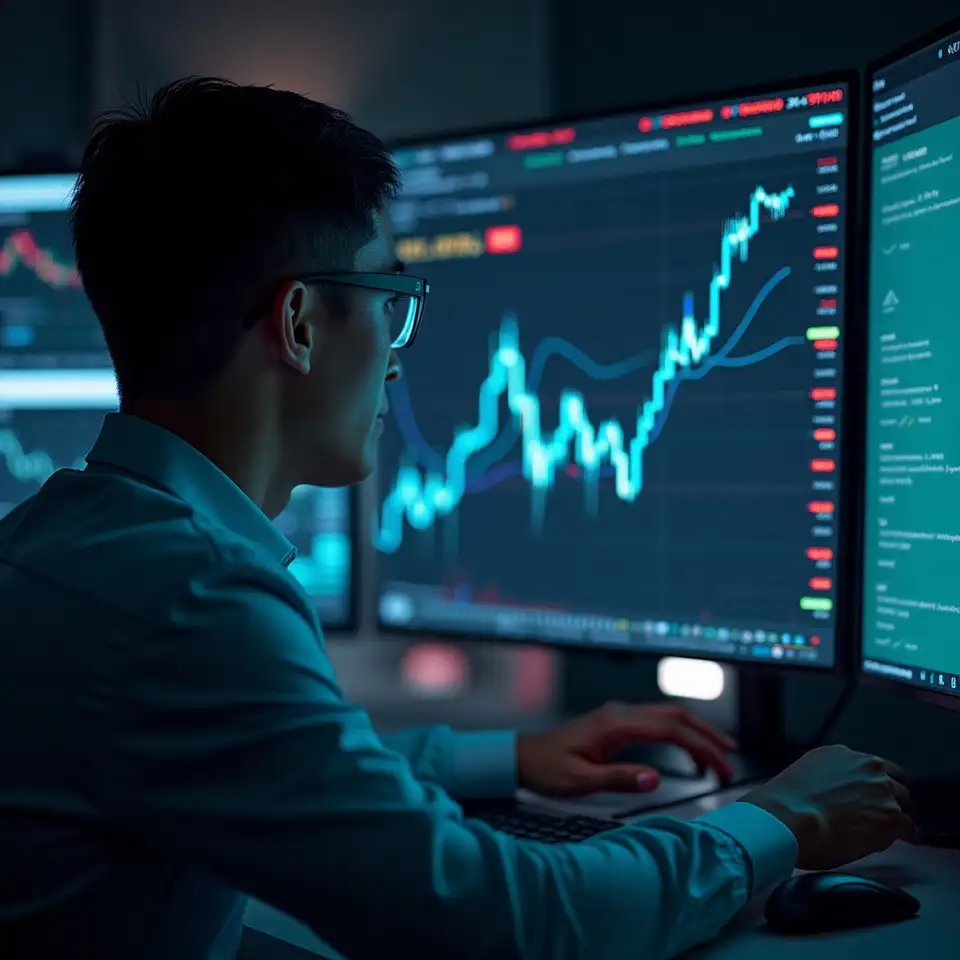
AI structural break detection you can actually audit

Built for researchers, quant teams, and institutions who need structural break detection
that fits inside serious governance and review processes.
Who you build structural break tools for
You work with people who ask hard questions about markets, not quick ones, and who need AI
structural break detection that respects the complexity of long-horizon financial data.
You built Sundoravitel for financial researchers, quantitative analysts, and institutional teams who live inside long time series. You understand their constraints: tight review cycles, scrutiny from committees, and the need to justify every methodological choice. That is why your tools emphasize documented assumptions, consistent metrics, and outputs that can be reproduced by an independent team with access to the same data.
You also recognize that structural breaks are only one part of a broader research agenda. Your workflows are designed to plug into existing pipelines for scenario analysis, risk assessment, and analytical reviews and personal consultations that users may pursue elsewhere. Sundoravitel does not replace human judgment or internal policy; it gives you a clearer map of when and how the underlying data-generating process appears to have shifted over time.
Because you operate in Canada and work with international teams, you pay close attention
to data protection and governance. You align your practices with Canadian privacy
expectations and global standards, minimizing the personal information you handle and
focusing on market-level time series. When questions arise, you respond with
documentation, not slogans, so teams can assess how Sundoravitel fits within their own
compliance frameworks.
Your method for structural breaks in financial markets
You treat structural break detection in financial markets like joinery: measure twice, cut once, document every angle. The Sundoravitel approach is organized into a simple, repeatable workflow that keeps your research auditable and your assumptions visible.
1
Context first
You begin by mapping each financial time series: sampling frequency, known events, instrument changes, and data quality issues. This context pass shapes which structural break tools you apply and prevents the AI from mistaking noise, stale quotes, or calendar effects for meaningful regime shifts.
Layered detection
You then run a layered detection process, combining multiple statistical tests with AI-based pattern recognition. Instead of trusting a single signal, you look for convergence across methods, ranking candidate structural breaks by strength and clarity within the surrounding market history.
Impact measurement
Once candidate breaks are identified, you quantify their impact on core properties of the series. You measure changes in level, volatility, serial dependence, and co-movement with related benchmarks, using consistent windows and clearly logged parameters for later review and replication.
4
Research outputs
Finally, you translate the analysis into researcher-ready artifacts. You produce timelines, annotated charts, and concise method summaries that can be cited, scrutinized, and extended. Every structural break is backed by traceable logic, not just an AI label on a plot.

How you work with long horizons
From raw series to documented breaks
You start with the data, not the model. Long-horizon financial time series arrive
with gaps, regime shifts, and measurement changes. You profile each series, document
quirks, and decide which segments deserve structural break analysis before any AI
touches them. Then you move to the detection layer. You combine classical
change-point methods with modern representation learning, treating the AI as a lens,
not an oracle. Each candidate break is scored, timestamped, and linked to the exact
transformation path that produced it, so you can retrace every step later.
Quantification comes next. You measure shifts in mean, variance, correlation
structure, and tail behavior around each structural break, using consistent windows
and clear parameter choices. The result is a set of numbers that can sit comfortably
inside an academic paper or an internal risk memo. Finally, you package the work.
You generate researcher-ready outputs: plots that highlight breaks, tables with
effect sizes, and short methodological notes that explain how the AI contributed. No
mystery, no black box, just a careful chain from raw data to documented structural
change.